Week 9.2 Estimating Demand, Cost, and Profit
You have seen the process in setting a price in the previous lesson, along with step 1 in the process. In this lesson, we will cover steps 2 and 3.
Steps in Setting Price. 2) estimate demand and revenue, and 3) estimate cost, volume, and profit relationships.
©University of Waterloo
Step 2: Estimate Demand and Revenue
Demand shows the quantity buyers are willing to buy at each price level. The law of demand states that price and quantity demanded are negatively correlated. As the price falls, people demand more quantity. Conversely, as price goes up, quantity demanded decreases. Other than price, there are three factors that we pay attention to:
- Consumer tastes
- Price (and availability) of related products
- Consumer income
Consumer Tastes
Tastes can change and shift based on many factors, such as demographics, culture, and technology. As tastes change it shifts the demand.
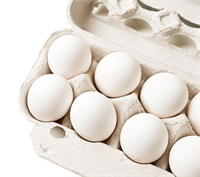
Eerik/iStock/Getty Images
Example: Consumers show more interest in buying eggs due to the popularity of a certain type of diet. In this case, the demand for eggs increases.
Price (and Availability) of Related Products
As the price of a close substitute product falls and its availability increases, the demand for a product declines. The converse is also true.
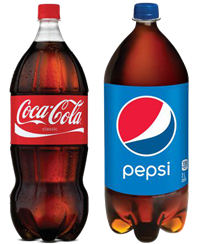
Retrieved from https://www.walmart.ca
/en/grocery/drinks/soft-drinks/N-3816
Example: If we assume Pepsi and Coke are close substitutes, the demand for Coke falls as the price of Pepsi declines. That is because many people switch from Coke to Pepsi, due to its lower price.
Complement goods have a different effect on demand than supplement goods. Complement goods are the ones that are mostly consumed together such as ham and eggs. As price of a complement good increases, the demand for the good decreases. The converse is also true.

vectorplusb/iStock/Getty Images
Example: Computers and operating software are complement goods. When you buy a computer you need to buy software to run on the computer. If the price of computers goes up, people will demand less computers and as a result the demand for software will also decline.
Consumer Income
For normal goods, as real consumer income (allowing for inflation) increases, demand for a product also increases.

Rawpixel/iStock/Getty Images
Example: As your income goes up you might want to buy a new car or upgrade your existing ride.
The first of these three factors influences what consumers want to buy, and the third affects what they can buy. These three factors, along with price, are known as demand factors.
Movement Along vs. Shift of a Demand Curve
Movement and shift of demand are different effects. When the price of the good itself changes it leads to a movement along the demand curve, assuming the other factors (consumer tastes, price of related goods, and consumer income) remain unchanged. This is shown below in plot A. When the price goes down from $8 to $6, the quantity demanded increases from 2 to 3 units. The converse is true when the price increases. Note that the change in the price of the good itself does not shift the demand.
We see a shift in the demand in plot B, where the demand curve shifts to the right, from D1 to D2. This is what an increase in the demand looks like. For example, when consumer incomes double, then the demand increases and shifts to the right for normal goods.
Remember that a change in the price of the product itself does not shift the demand. It only leads to a movement on the demand curve. Changes in the other three factors (consumer tastes, price of substitutes, and consumer income) are what shift the demand.
Movement and Shift in Demand. Plot A shows movement along the demand curve. Plot B shows the demand curve shifting to the right (increasing).
©University of Waterloo
Price Elasticity of Demand
When we talk about demand, we should also consider price elasticity of demand.
Price elasticity of demand is defined as the percentage change in quantity demanded relative to a percentage change in price. We divide the percentage change in quantity demanded by the percentage change in price, to calculate price elasticity of demand. It represents the sensitivity of quantity demanded to the changes in price.
When demand is price elastic, its elasticity is greater than one. For a product with elastic demand, a slight decrease in price results in a relatively large increase in quantity demanded. The reverse is also true. In most cases, the more substitutes a product or service has, the more likely it is to be price elastic. This is because of consumers having a lot of flexibility in their choices. When the price of the product goes up, consumers can easily switch to substitute products, which significantly reduces quantity demanded for the product.
When the demand is price inelastic, its elasticity is less than one. For a product with inelastic demand, slight increases or decreases in price will not significantly affect the demand. Most necessities have inelastic demand, as do products/services with no close alternatives. This is due to consumers not having much flexibility in their choices.

xefstock/iStock/Getty Images
Example: Gasoline has inelastic demand. An increase in the price of gas will have relatively minor impact on the number of units of gas sold.
Critical Thinking Question: Think about the product or service in your group work project. Is the demand price elastic or inelastic? If you choose to increase the price, how much does the quantity demanded decrease? How responsive is the demand to changes in price?
Estimating Revenue
As we mentioned before, total revenue (TR) is the total money received from the sale of a product.
TR = Price × Quantity sold = P × Q
Revenue is a part of profit and increasing revenue might increase profits as long as the firm is able to control their costs. Remember that
Profit = Total Revenue - Total Cost = TR – TC.
Stop and Think Question: Does increasing your price imply an increase in your revenue? Does it imply an increase in your profit? Think about price elasticity of demand and also costs before clicking reveal.
Click to reveal answer.
An increase in price does not necessarily imply an increase in the revenue. This is due to the negative relationship between price and quantity demanded. When price goes up, quantity demanded goes down. By how much? Price elasticity of demand tells us the answer. Total revenue, which is equal to price times quantity demanded, would increase if the impact from the increase in price is greater than the impact from the decrease in quantity demanded. When it comes to profit, an increase in revenue might lead to higher profits if the firm is able to keep their costs unchanged.
Step 3: Estimating Cost, Volume, and Profit Relationships
Now we move onto the third step in setting a price level. We start with costs.
The Importance of Controlling Costs
Cost is a part of the profit calculation. Businesses might go bankrupt if their costs get out of control. When total cost exceeds total revenue, profit is negative, which implies a loss. That is why businesses pay a lot of attention to their costs and try to make sure that costs are less than their total revenue. Pricing directly affects total revenue but we cannot neglect the importance of costs in profit. That is why we pay attention to costs in setting our price.
Three cost concepts are important in pricing decisions: total cost, fixed cost, and variable cost.
Total Cost (TC) = Fixed Cost (FC) + Variable Cost (VC)
- Total cost is the total expenses incurred by a firm in producing and marketing a product.
- Fixed costs are the firm's expenses that are stable and do not change with the quantity of product that is produced. Example: Salaries of executives and lease charges on a building or the cost of rental equipment.
- Variable costs are the sum of the expenses of a firm that vary directly with the quantity produced. Example: Wages paid to labour and the cost of materials used in producing the product.
Break-Even Analysis
Break-even analysis is a simple calculation that is very useful for the businesses to compare total revenue and total cost to determine profitability at various levels of output. It is used in calculating the quantity of units sold that would allow the firm to make zero profit. Zero profit means that the firm breaks even.
The break-even point (BEP) is the quantity at which total revenue and total costs are equal.
Remember that Profit = Total Revenue (TR) – Total Cost (TC).
When TR = TC, Profit =0 .
Businesses make zero profit at the break-even point. Profit comes from any units sold beyond the BEP.
There is a simple formula used in calculating a break-even point:
BEP = Fixed cost/(Unit price – Unit variable cost)
Example: Break-even analysis can be applied to a frame shop. Assume that the price a customer will pay for each picture framing is $100. Suppose the fixed cost (FC) for the business is $28,000 and unit variable cost (UVC) for a picture is $30.
BEP = Fixed cost/(Unit price – Unit variable cost) = 28000/(100–30) = 400
Break-even Analysis Graph. The break-even analysis graph shown here is for the frame shop example. It shows that the total revenue and total cost intersect and are equal at a quantity of 400 pictures sold, which is the break-even point. When the firm sells 400 units, it makes zero profit. If the firm is able to sell more than 400 units, it makes positive profit. If the firm sell less than 400 units, it makes negative profit, which is a loss.
©University of Waterloo
Critical Thinking Question: Try to calculate the break-even quantity for the company you are working on in your group project. What do you need to know in calculating the BEP?