Week 6.3 Product Positioning and Sales Forecast
Positioning
Positioning helps companies place their products/services with respect to competitive products/services. Positioning refers to the place an offering occupies in consumers' minds on important attributes relative to competitive products. Re-positioning involves changing the relative place of the offering versus competitive offerings.
There are two main approaches: head-to-head and differentiation positioning.
Head-to-head positioning involves competing directly with competitors on similar product attributes in the same target market.

Retrieved from https://www.avis.
ca/en/home; https://www.enter
prise.ca/en/home.html
Example: Car rental companies Enterprise Rent-A-Car and Avis are positioned head-to-head.
Differentiation positioning involves seeking a less competitive, smaller market niche in which to locate a brand, usually stressing the unique aspects of the product. Differentiation positioning helps companies minimize cannibalization.
Retrieved from http://www.
leadingbrandsinc.com/
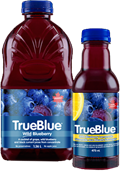
Example: Leading Brands Inc. from Vancouver positioned their TrueBlue blueberry drink in specialty health stores targeting health conscious individuals. They applied differentiation positioning to avoid the competition of bigger national brands.
Writing a positioning statement helps companies specify their positioning. The idea that they have in their minds when they are positioning the product comes to life when the companies convert the idea into a brief written positioning statement.

Retrieved from https://www.volvocars.com/en-ca/
cars/new-models/xc90
Example: Volvo’s positioning statement for the North American market says, "For upscale families who desire a carefree driving experience, Volvo is a premium-priced automobile that offers the utmost in safety and dependability."
Critical Thinking Question: Can you write a positioning statement for your group work project? Remember that you are re-positioning based on your strategy.
Product Positioning with Perceptual Maps
A positioning statement helps to covert the idea of positioning into more solid understanding. In addition to a positioning statement, we can take a step further and use a perceptual map to visually represent the positioning. A perceptual map is a two-dimensional figure containing the location of the product as well as the location of competitive products. It is a graph with a horizontal axis and a vertical axis. Important attributes of the product are used on the two axes. The perceptual map visually shows how consumers perceive competing products versus this product.
Example: In earlier lessons we have learned about the research Canadian milk producers have done. They wanted to increase milk sales, especially among adults. As a result of their exploratory and descriptive research, they realized that most adults see milk as fattening. Most adults avoided chocolate milk as they saw it as a kid’s drink. Dairy farmers decided to re-position chocolate milk to the location “B” in the perceptual map in order to increase their sales. You see the competitive products as well as the original position of chocolate milk on the perceptual map below. Dairy farmers achieved higher sales, much of it because of adult consumption. They used marketing campaigns to highlight the nutritional value of milk as well as innovative packaging to achieve the re-positioning.
Perceptual Map for Milk and Other Beverages (~2 min)
Critical Thinking Question: Can you make a perceptual map for your group work project? Which product attributes are the most relevant for the map? Remember that you are re-positioning based on your strategy.
Sales Forecasting
Segmentation and target market selection are closely related to sales forecasts. A sales forecast is an estimate of the total sales of a product during a specified time period under specified environmental conditions and its own marketing efforts.
There are three main sales forecasting techniques:
- Judgments of the Decision Maker
- Surveys of Knowledgeable Groups
- Statistical Methods
Judgments of the Decision Maker
The majority of forecasting is done by judgment. It is a direct forecast that involves estimating the value to be forecast without any intervening steps. An experienced manager would not have much difficulty in making a decision based on his/her judgement. There is lost-horse forecasting which involves making a forecast using the last known value and modifying it according to positive or negative factors expected in the future. Knowledgeable and experienced managers use their existent sales figures and modify them based on their expectation of the market performance.

LumineImages/iStock/Getty Images
Example: An example of daily decision making can include how much money I should get out of the ATM.
Surveys of Knowledgeable Groups
Businesses can apply survey methods and ask knowledgeable groups to estimate future sales. One group to survey would be the prospective customers. A survey of buyers' intentions forecast involves asking prospective customers if they are likely to buy a product during some future time period. Another group to survey is the firm’s own salespeople. They are involved in sales daily and they develop a sense of the market better than most other employees. A salesforce survey forecast involves asking a firm's salespeople to estimate sales during a coming period.
Statistical Methods
The most popular statistical method is trend extrapolation. It involves extending a pattern observed in past data into the future. When the observed pattern is linear - described with a straight line - it is called linear trend extrapolation. It is a simple method and is easy to apply. It is fairly simple to plot data in Excel and ask for the line of best fit. When you expand the line into the future years, it is linear trend extrapolation. It gives accurate results as long as the assumptions prove correct. If there are major changes in global or local markets, the predictions will likely be wrong.
Example: The figure at right shows linear trend extrapolation of the Acme Corporation. Their past sales data is graphed up to year 2000. The line of best fit is graphed and extended up to 2012. The forecast in this figure is between 2000 and 2012.
From 1988 to 2000, the sales more or less followed a linear trend. If there are no major changes in environmental conditions, we would expect the sales to continue to rise on that linear path. However, the actual sales did not turn out to be the same as forecasted, as shown in the figure. The firm should look into the reasons behind the change in the linear pattern of sales. It is likely that the changes of uncontrollable (environmental) factors forced the sales not to follow the past trend.
Critical Thinking Question: Plot the sales data from the company you are studying for your group project. Does it follow a linear trend?